
Streetlight Effect in Networking Research
Posted:
Choosing which problem deserves our time is one of the hardest parts of doing a PhD. Recently, Prof. Vyas Sekar’s HotNets paper[1] made me pause and ask an important question: are we working on the problems that matter most, or simply looking where the light is brightest? To explore that question across a wider slice of our community, I extended his SIGCOMM title study to cover four major networking conferences, full paper abstracts, and cleaned research-paper proceedings through 2025.[2]
The original paper
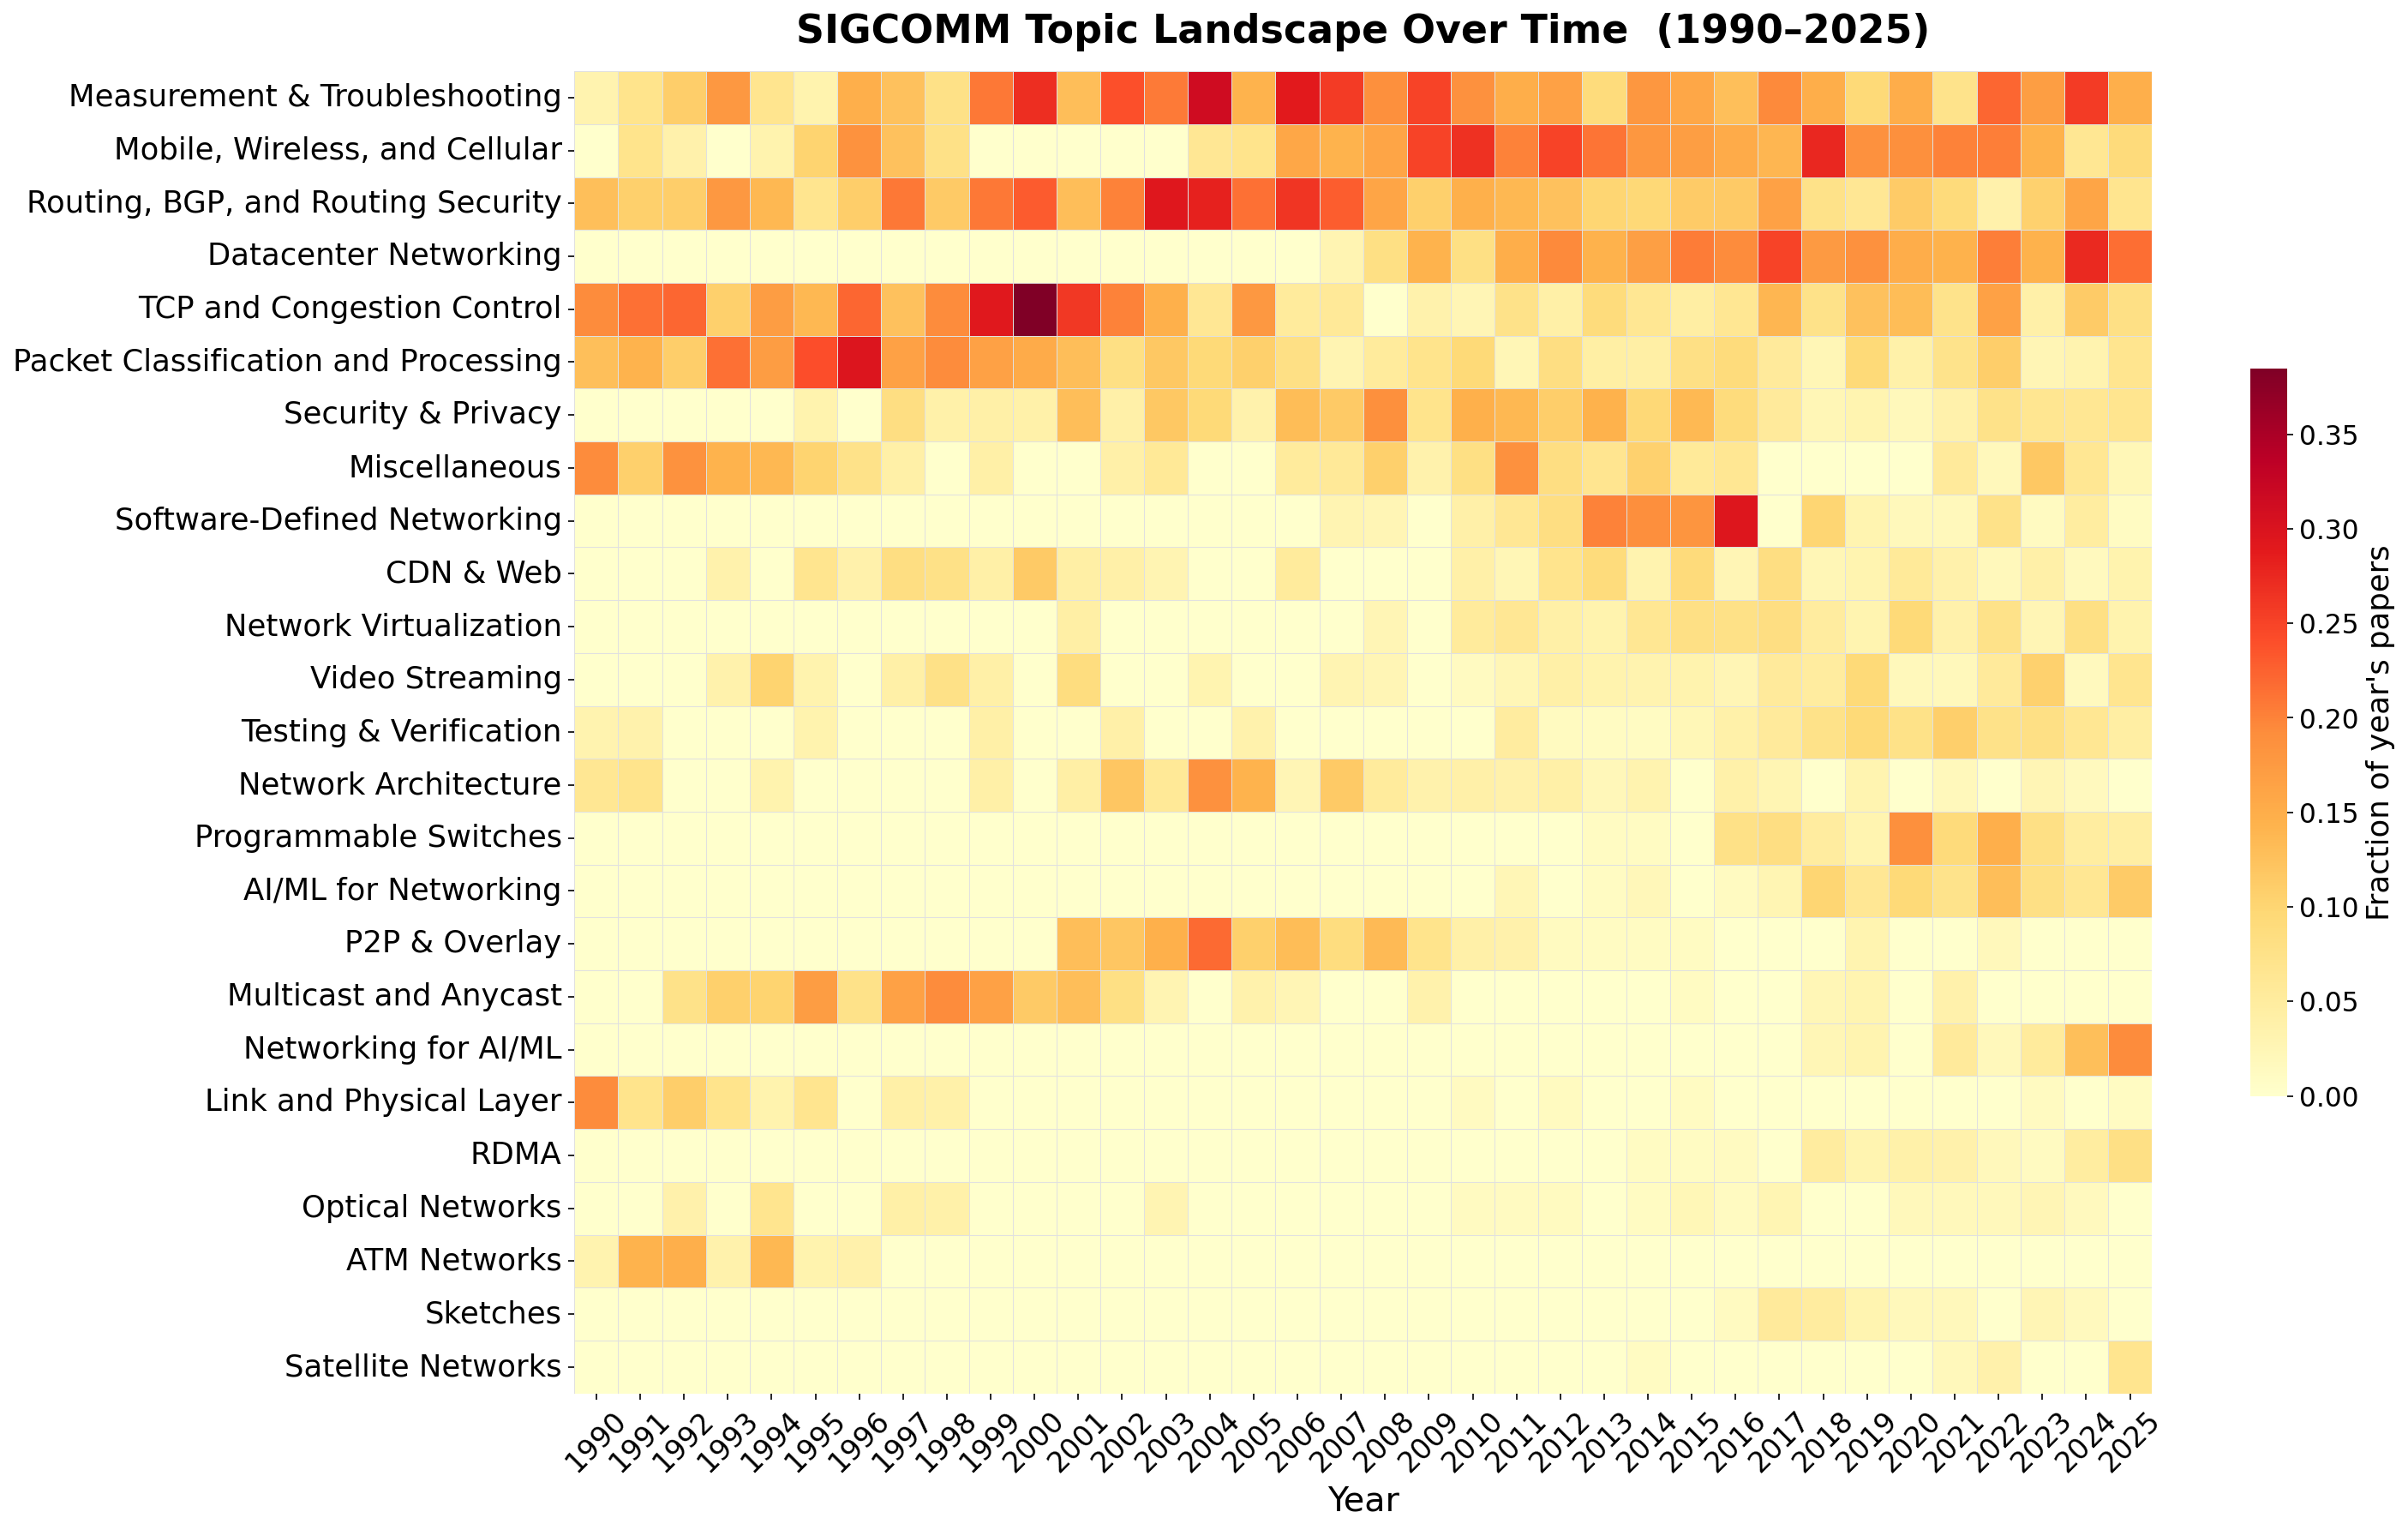
The streetlight effect describes our tendency to search for answers where looking is easiest. In networking research, established problems come with ready-made simulators, public traces, and standard benchmarks.[1] Those tools make progress easy for authors to measure and straightforward for reviewers to evaluate. Over time, career, reviewing, and funding incentives reinforce this focus. To help the community explore new territory, Prof. Sekar proposes building more streetlights through shared research infrastructure, outside problem statements, and broader evaluation criteria.
At the same time, Prof. Sekar notes another natural reading of the SIGCOMM timeline. Our community may simply be adapting as real-world technologies mature and new bottlenecks appear. In the paper, he suggests extending the analysis to additional conferences and looking beyond paper titles to see what the broader data shows.[1]
What I did differently
My analysis builds on Prof. Sekar’s framework while making four key changes to the data and methodology:[2]
- Four conferences instead of one: The original paper examined SIGCOMM proceedings. I expanded the dataset across SIGCOMM, NSDI, IMC, and CoNEXT, covering 4,154 research papers published through 2025.
- Full abstracts in addition to titles: The original study inferred topics from paper titles alone. I collected the full abstract for every paper in the corpus and classified each paper using its title and abstract together.
- Main research papers only: Bibliographic databases often mix full conference papers with short posters, demos, keynotes, and duplicate records. I filtered every venue’s proceedings to keep only full research papers so that large poster and demo tracks do not skew annual topic shares.
- Expanded topic coverage and equal-size breadth comparisons: I added Distributed Systems & Storage to cover the scope of venues like NSDI, applied the same classification rules across all years without date cutoffs, and compared topic breadth by sampling an equal number of papers from each conference every year.
Finding 1: Paper abstracts reveal research topics that short titles leave out. Authors often write short, memorable titles that name a system without describing how it works. Adding abstracts changes the matched topics for about four in five papers and greatly reduces the “Miscellaneous” category. Those changes measure sensitivity to the input text; they do not establish that every new label is correct. The AI comparison exposes an important classification limit. Prof. Sekar distinguishes between applying AI methods to networking problems and building networks to support AI workloads like GPU training and inference.[1] Our current rules count more infrastructure matches at SIGCOMM, NSDI, and CoNEXT, but they also suppress the AI-method label whenever an AI-workload cue matches. Removing that precedence reverses the ordering in all three venues. The alternative matches are not validated contributions either, so an independent human review is needed before claiming that AI infrastructure is ahead of AI methods.
Analysis across 4 conferences
Finding 2: Each conference focuses on a different part of networking. Comparing all four conferences side by side shows how our community divides its work across venues. NSDI focuses heavily on distributed systems, storage, datacenters, and AI infrastructure. SIGCOMM covers a similar mix of systems and networking topics, including a large share of distributed systems work that becomes visible once we track it as its own category. IMC looks very different from the other three venues. Almost every IMC paper involves measurement, and over the past fifteen years its focus has shifted strongly toward web systems, security, and user privacy. CoNEXT covers a broad mix of networking topics like SIGCOMM, while keeping the strongest focus on wireless and mobile networks.
Select a cell to inspect its papers below.

Finding 3: Major technology trends rise and fall across all four venues at the same time. Even though each conference has its own focus, all four venues move together when technologies change. Twenty years ago, peer-to-peer overlays and inter-domain routing were major topics at every conference. As those areas matured and cloud computing grew, peer-to-peer work nearly disappeared across all four venues, while datacenter networking, programmable switches, and AI infrastructure rose together at SIGCOMM, NSDI, and CoNEXT. The timelines also shed light on two examples discussed in Prof. Sekar’s paper: congestion control and software-defined networking.[1] Congestion control stays active decade after decade because every new network environment breaks old transport assumptions, whether in datacenter fabrics, QUIC, cellular links, satellites, or GPU clusters. Meanwhile, software-defined networking matches fall after the mid-2010s as verification and programmable-switch matches rise. One plausible explanation is that SDN ideas moved into more specific areas; the topic counts alone cannot establish that transition.
Finding 4: Measured topic breadth grows, but breadth alone cannot establish what we neglect. One natural question is whether the streetlight effect has caused conferences to narrow onto fewer topics over time. Because conferences accept many more papers today than they did twenty years ago, raw topic counts can be misleading. To compare years fairly, I sampled the same number of papers from each conference every year and measured how evenly those papers spread across topics. Across all four conferences, papers today spread across a wider range of technical topics than they did in the late 2000s, both under our 28 topic categories and when an automated model groups papers by shared words.

Broader technical coverage leaves an important question open: which settings and communities benefit? I also searched for mentions of access, home networks, energy, economics, and research tools in the same recent titles and abstracts. Several settings appear less often than the major technical categories, but research and evaluation tools are mentioned frequently. A mention of a simulator or dataset does not tell us whether a paper builds a shared resource or simply uses one. These counts cannot establish that a setting is neglected or that shared infrastructure is scarce.
Caveats and takeaways
Keyword matching on titles and abstracts is still a rough approximation. An abstract often mentions baseline protocols, measurement tools, or everyday words that have little to do with the paper’s main contribution. I manually fixed the most obvious false matches, including systems papers that used words like “quantum” or “entanglement” in a non-quantum sense. Still, with 4,154 papers in the dataset, a few noisy labels inevitably remain.
More importantly, paper counts only show what made it through peer review. These charts can’t tell us which bold ideas got rejected, how hard a problem is, or how much a topic actually matters in the real world. When an area like datacenter networking or AI infrastructure takes off, part of that surge simply reflects where new hardware and real bottlenecks are emerging.
Even so, digging through 20 years of papers made me think differently about how we choose research problems. As a PhD student, it’s easy to gravitate toward well-lit topics because the simulators, traces, and baselines are already sitting there on github. Working on popular cloud and AI problems is genuinely exciting, esp. when new workloads break old assumptions. At the same time, when dozens of groups are already chasing the same benchmark, another small throughput win quickly blends into the crowd. Some of the most rewarding opportunities lie in bringing solid systems work to overlooked settings like home and rural networks, or in building the open datasets and testbeds that help the whole community see somewhere new.[1]
Papers used in the analysis
You can filter by conference, topic, year, or keyword below to browse all 4,154 papers and read their abstracts. Papers appear newest first, with titles sorted alphabetically within each year.
Loading paper evidence…
| Conference | Year | Paper and abstract | Topics |
|---|
References
- [1] Vyas Sekar, “More Streetlights, Please: On the Streetlight Effect in Networking Research,” ACM HotNets, 2026.Back to citation 1 · Back to citation 2 · Back to citation 3 · Back to citation 4 · Back to citation 5 · Back to citation 6 · Back to citation 7
- [2] Hongyu Hè, “Streetlight Effect in Networking Research: Cross-Conference Data and Analysis Code,” GitHub, 2026.Back to citation 1 · Back to citation 2
Leave a comment